
Make a living and have a life.
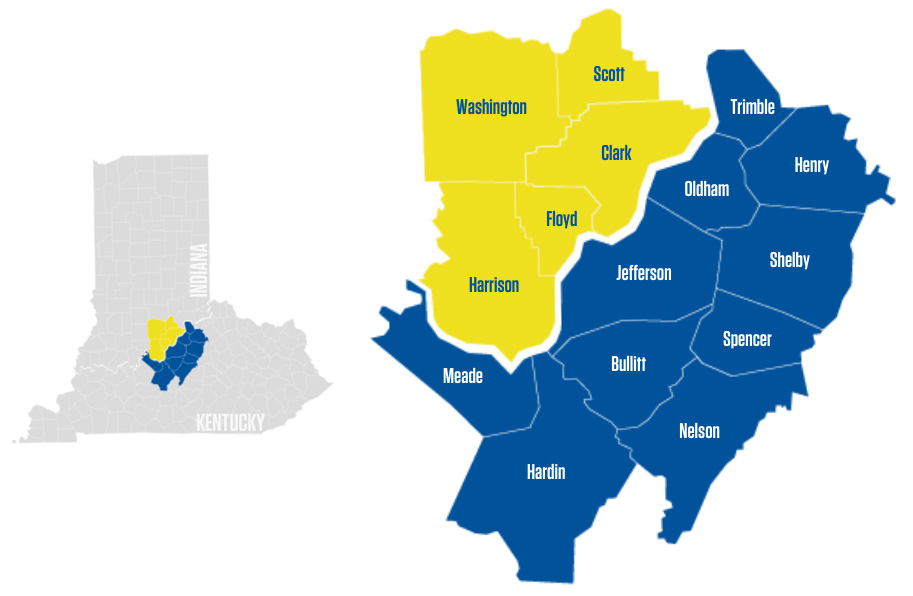
Greater Louisville is a great place to live and work, and a great place to locate or grow your business. Our 15-county bi-state region has top notch and diverse talent, a competitive cost of doing business, a pro-business environment, and a robust workforce pipeline that includes work-ready skill building, industry-specific training programs, employer networks, job placement, university-industry partnerships, and customized talent attraction solutions.
Greater Louisville Inc. is hard at work to support our local industries and provide grassroots services across industry sectors. In close collaboration with regional partners, GLI provides confidential relocation and economic development services.
Click here to view our regional dashboard.
Click here for a downloadable regional comparison spreadsheet.
Louisville by the Numbers
Housing Market
Louisville is in the 97th percentile for housing markets across the top 100 largest metros.
Commute Time
Our average commute time of 23.9 minutes is among the shortest in the US.
Cost of Living
The cost of living in Louisville is nearly 4% lower than the national average.
Cost of Business
The cost of doing business in Louisville is over 12% lower than the national average.
Welcome to Greater Louisville
With a workforce participation rate above the national average and steady population growth over the last several decades, Louisville is becoming one of the most attractive places to do business. In 2023, Site Selection Magazine, the nation’s leading publication for corporate expansion and area economic development, named Louisville a Top 5 U.S. Metro for Economic Development.
Age Distribution
15-County Region
| Year of Data | 2022 | 2023 |
|---|---|---|
| 19 and Under | 24.7% | 24.6% |
| 20-24 | 5.9% | 5.9% |
| 25-34 | 13.7% | 13.6% |
| 35-44 | 13.1% | 13.3% |
| 45-54 | 12.4% | 12.4% |
| 55-64 | 13.1% | 12.9% |
| 65 and Over | 17.1% | 17.3% |
Source: Lightcast
Educational Attainment
15-County Region
| Level | Percent of Population | Population |
|---|---|---|
| Less Than 9th Grade | 2.7% | 24,248 |
| 9th Grade to 12th Grade | 6.2% | 55,520 |
| High School Diploma | 29.2% | 263,157 |
| Some College | 21.5% | 193,977 |
| Associate's Degree | 8.8% | 79,362 |
| Bachelor's Degree | 19.3% | 173,480 |
| Graduate Degree and Higher | 12.3% | 111,178 |
Source: Lightcast
Ethnic Composition
15-County Region
| Race/Ethnicity | Population | Percent of Population |
|---|---|---|
| White, Non-Hispanic | 1,136,901 | 74.44% |
| Black, Non-Hispanic | 219,577 | 14.38% |
| White, Hispanic | 79,202 | 5.19% |
| Two or More Races, Non-Hispanic | 39,163 | 2.56% |
| Asian, Non-Hispanic | 35,611 | 2.33% |
| Black, Hispanic | 6,467 | 0.42% |
| American Indian or Alaskan Native, Non-Hispanic | 3,053 | 0.20% |
| Two or More Races, Hispanic | 3,128 | 0.20% |
| American Indian or Alaskan Native, Hispanic | 1,682 | 0.11% |
| Native Hawaiian or Pacific Islander, Non-Hispanic | 1,214 | 0.08% |
| Asian, Hispanic | 776 | 0.05% |
| Native Hawaiian or Pacific Islander, Hispanic | 427 | 0.03% |
| Total | 1,527,202 | 100.00% |
Source: Lightcast
Household Trends
15-County Region
| County | Homeowner Vacancy Rate | Housing Units | Median House Value | Median Monthly Rent | Percent of Occupied Housing Units |
|---|---|---|---|---|---|
| Bullitt County, KY | 1.2% | 32,418 | $182,000 | $879 | 94.0% |
| Clark County, IN | 1.5% | 51,790 | $162,800 | $903 | 89.6% |
| Floyd County, IN | 1.8% | 34,111 | $187,900 | $868 | 88.3% |
| Hardin County, KY | 1.0% | 46,589 | $160,600 | $854 | 90.8% |
| Harrison County, IN | 1.5% | 16,703 | $169,400 | $820 | 86.4% |
| Henry County, KY | 1.4% | 6,626 | $140,700 | $810 | 90.1% |
| Jefferson County, KY | 1.2% | 354,062 | $190,700 | $954 | 91.3% |
| Meade County, KY | 1.9% | 11,967 | $164,100 | $859 | 86.3% |
| Nelson County, KY | 0.9% | 19,544 | $169,500 | $844 | 92.9% |
| Oldham County, KY | 0.3% | 22,894 | $314,300 | $1,032 | 95.8% |
| Scott County, IN | 1.2% | 10,688 | $117,100 | $733 | 89.1% |
| Shelby County, KY | 1.1% | 18,587 | $212,500 | $867 | 91.7% |
| Spencer County, KY | 0.0% | 7,358 | $243,400 | $847 | 93.7% |
| Trimble County, KY | 2.5% | 3,856 | $132,500 | $769 | 84.0% |
| Washington County, IN | 1.8% | 12,111 | $131,400 | $663 | 87.9% |
Source: Lightcast
Crime Rate
Louisville MSA
| MSA | Violent Crime Rate Per 100,000 Inhabitants | Property Crime Rate Per 100,000 Inhabitants |
|---|---|---|
| Louisville | 436.8 | 2864 |
| Grand Rapids | 321.5 | Not Reported |
| Greenville | Not Reported | Not Reported |
| Tulsa | 529.6 | 3227.8 |
| Knoxville | 353.7 | 2126.6 |
| Omaha | 413.1 | 2646.6 |
| Greensboro | 530.2 | 2695.9 |
| Charlotte | Not Reported | Not Reported |
| Oklahoma City | 461.0 | 3069.9 |
| Cincinnati | 237.4 | 1976.9 |
| Columbus | 286.5 | 2390.3 |
| Nashville | 570.5 | 2449.5 |
| St. Louis | Not Reported | Not Reported |
| Kansas City | Not Reported | Not Reported |
| Indianapolis | Not Reported | Not Reported |
| Birmingham | Not Reported | Not Reported |
| Memphis | 1120.5 | 4053.4 |
Source: FBI
Cost of Doing Business
| MSA | Overall Cost | Labor | Office Rent | Energy | Taxes |
|---|---|---|---|---|---|
| Louisville | 87.9 | 96.6 | 62.8 | 91.2 | 93 |
| Grand Rapids | |||||
| Greenville | 90.9 | 106.1 | 66.5 | 84.3 | 85.7 |
| Tulsa | |||||
| Knoxville | |||||
| Omaha | 88.9 | 96.3 | 74.6 | 86.4 | 92.1 |
| Greensboro | |||||
| Charlotte | |||||
| Oklahoma City | |||||
| Cincinnati | |||||
| Columbus | 97.8 | 93 | 81.6 | 118.1 | 104.2 |
| Nashville | 95.4 | 93.8 | 104.7 | 97.6 | 69.4 |
| St. Louis | 91.7 | 101.8 | 79.6 | 86.3 | 78.8 |
| Kansas City | |||||
| Indianapolis | 90.9 | 87.5 | 66.1 | 114.7 | 101.6 |
| Birmingham | |||||
| Memphis | 88.4 | 98 | 63.4 | 95.1 | 74.1 |
Source: North American Business Cost Review
Cost of Living
| MSA | Overall | Grocery | Housing | Utilities | Transportation | Healthcare | Miscellaneous |
|---|---|---|---|---|---|---|---|
| Louisville | 95.7 | 93.5 | 78.8 | 105.3 | 113.0 | 75.7 | 106.8 |
| Grand Rapids | 94.7 | 92.3 | 84.8 | 102.8 | 101.3 | 95.3 | 100.1 |
| Greenville | 90.6 | 98.6 | 71.5 | 97.4 | 90.4 | 97.6 | 100.1 |
| Tulsa | 89.7 | 95.3 | 81.6 | 93.6 | 82.5 | 88.3 | 94.7 |
| Knoxville | 84.9 | 89.9 | 71.1 | 98.4 | 91.6 | 91.5 | 87.8 |
| Omaha | 92.5 | 96.5 | 84.0 | 94.0 | 102.9 | 96.8 | 94.0 |
| Greensboro | 84.1 | 96.6 | 61.1 | 93.1 | 71.9 | 120.3 | 93.0 |
| Charlotte | 97.9 | 97.4 | 88.9 | 91.6 | 93.4 | 112.6 | 106.3 |
| Oklahoma City | 83.9 | 91.1 | 71.0 | 94.4 | 90.8 | 100.6 | 84.4 |
| Cincinnati | 96.4 | 100.9 | 81.1 | 92.6 | 110.8 | 101.3 | 103.7 |
| Columbus | 89.7 | 96.7 | 79.6 | 93.4 | 89.6 | 86.5 | 94.3 |
| Nashville | 97.7 | 97.5 | 106.1 | 88.7 | 91.3 | 90.9 | 95.9 |
| St. Louis | 86.3 | 97.3 | 74.3 | 93.4 | 90.2 | 88.6 | 88.0 |
| Kansas City | 94.9 | 92.3 | 102.6 | 102.0 | 86.2 | 88.2 | 91.1 |
| Indianapolis | 92.5 | 96.6 | 82.8 | 107.7 | 92.6 | 88.1 | 95.2 |
| Birmingham | 91.9 | 91.6 | 80.1 | 101.7 | 90.2 | 98.5 | 98.7 |
| Memphis | 87.2 | 91.9 | 79.9 | 90.6 | 92.6 | 87.8 | 88.6 |
Source: COLI
Drive Time
| MSA | Time |
|---|---|
| Louisville | 23.9 |
| Grand Rapids | 21.8 |
| Greenville | 22.8 |
| Tulsa | 21.5 |
| Knoxville | 23.6 |
| Omaha | 20.2 |
| Greensboro | 22.4 |
| Charlotte | 26.5 |
| Oklahoma City | 22.7 |
| Cincinnati | 24.7 |
| Columbus | 23.7 |
| Nashville | 27.3 |
| St. Louis | 25.6 |
| Kansas City | 23.0 |
| Indianapolis | 24.8 |
| Birmingham | 26.2 |
| Memphis | 24.1 |
Source: Title Max
Employment Trends By Industry
Louisville MSA
| Industry | April 2023 | 2022 Annual | 2021 Annual | 2020 Annual |
|---|---|---|---|---|
| Total Nonfarm | 690,700 | 689,300 | 681,400 | 657,500 |
| Mining, Logging, and Construction | 30,600 | 29,900 | 30,000 | 29,200 |
| Manufacturing | 86,500 | 85,600 | 80,900 | 80,700 |
| Trade, Transportation, and Utilities | 161,400 | 166,900 | 164,400 | 161,200 |
| Information | 9,000 | 8,900 | 8,500 | 8,300 |
| Financial Activities | 45,600 | 46,600 | 49,200 | 48,200 |
| Professional Business Services | 89,200 | 88,700 | 92,100 | 87,600 |
| Education and Health Services | 100,300 | 101,100 | 98,100 | 96,000 |
| Leisure and Hospitality | 69,900 | 64,200 | 61,800 | 51,700 |
| Other Services | 25,900 | 25,300 | 24,200 | 23,300 |
| Government | 72,300 | 72,100 | 72,200 | 71,300 |
Source: BLS
Employment Wages by Occupation
15-County Region
| Description | Employment | 2022 Location Quotient | Median Hourly Earnings | Mean Hourly Earnings | Mean Annual Earnings |
|---|---|---|---|---|---|
| All Occupations | 732,372 | 1.0 | $21.57 | $25.47 | $52,905.01 |
| Management Occupations | 44,822 | 0.89 | $40.77 | $48.79 | $101,482.15 |
| Business and Financial Operations Occupations | 36,778 | 0.80 | $31.26 | $36.27 | $75,433.32 |
| Computer and Mathematical Occupations | 17,550 | 0.76 | $35.34 | $38.16 | $79,367.13 |
| Architecture and Engineering Occupations | 10,901 | 0.92 | $36.32 | $38.31 | $79,691.71 |
| Life, Physical, and Social Science Occupations | 3,781 | 0.57 | $30.17 | $34.89 | $72,561.13 |
| Community and Social Service Occupations | 13,182 | 1.03 | $23.50 | $26.07 | $54,216.67 |
| Legal Occupations | 5,687 | 0.90 | $34.82 | $48.35 | $100,558.75 |
| Educational Instruction and Library Occupations | 29,673 | 0.71 | $25.61 | $26.90 | $55,947.99 |
| Arts, Design, Entertainment, Sports, and Media Occupations | 11,741 | 0.89 | $21.13 | $26.45 | $55,007.06 |
| Healthcare Practitioners and Technical Occupations | 46,532 | 1.13 | $31.26 | $41.22 | $85,746.27 |
| Healthcare Support Occupations | 25,605 | 0.78 | $15.64 | $17.10 | $35,565.84 |
| Protective Service Occupations | 11,779 | 0.75 | $15.83 | $19.20 | $39,940.84 |
| Food Preparation and Serving Related Occupations | 54,031 | 0.97 | $11.65 | $12.83 | $26,683.67 |
| Building and Grounds Cleaning and Maintenance Occupations | 26,422 | 1.03 | $13.53 | $15.29 | $31,799.31 |
| Personal Care and Service Occupations | 22,129 | 1.14 | $12.54 | $15.33 | $31,881.97 |
| Sales and Related Occupations | 67,116 | 1.00 | $15.73 | $23.62 | $49,126.20 |
| Office and Administrative Support Occupations | 88,331 | 1.00 | $18.31 | $20.08 | $41,775.04 |
| Farming, Fishing, and Forestry Occupations | 1,706 | 0.33 | $13.11 | $15.85 | $32,967.15 |
| Construction and Extraction Occupations | 29,004 | 0.88 | $21.87 | $24.20 | $50,333.40 |
| Installation, Maintenance, and Repair Occupations | 31,037 | 1.08 | $23.04 | $25.14 | $52,288.24 |
| Production Occupations | 62,049 | 1.54 | $18.51 | $20.45 | $42,541.12 |
| Transportation and Material Moving Occupations | 90,502 | 1.44 | $18.17 | $21.73 | $45,205.79 |
| Military-only occupations | 2,014 | 0.46 | $13.76 | $18.89 | $39,301.59 |
Source: Lightcast
Income Data
15-County Region
| County | Median Household Income | Per Capita Income | Percent at Poverty Level |
|---|---|---|---|
| Bullitt County, KY | $67,892 | $31,194 | 8.3% |
| Clark County, IN | $62,296 | $31,542 | 6.3% |
| Floyd County, IN | $69,858 | $34,961 | 7.0% |
| Hardin County, KY | $59,863 | $32,151 | 7.6% |
| Harrison County, IN | $63,586 | $30,288 | 6.9% |
| Henry County, KY | $52,301 | $28,702 | 10.4% |
| Jefferson County, KY | $61,633 | $36,533 | 9.9% |
| Meade County, KY | $63,944 | $30,625 | 11.0% |
| Nelson County, KY | $64,354 | $32,121 | 5.2% |
| Oldham County, KY | $109,815 | $46,833 | 3.5% |
| Scott County, IN | $45,794 | $24,351 | 11.5% |
| Shelby County, KY | $73,974 | $34,732 | 6.4% |
| Spencer County, KY | $92,973 | $37,946 | 2.7% |
| Trimble County, KY | $62,125 | $26,799 | 9.5% |
| Washington County, IN | $53,932 | $26,393 | 8.1% |
Source: Lightcast
Labor Statistics
Louisville MSA
| Description | March 2023 | 2020 | 2010 | 2000 | 1990 |
|---|---|---|---|---|---|
| Civilian Workforce | 667,723 | 658,316 | 636,946 | 610,050 | 549,884 |
| Employed | 644,640 | 614,534 | 571,183 | 588,122 | 521,646 |
| Unemployed | 23,083 | 43,782 | 62,692 | 21,928 | 28,238 |
| Unemployment Rate | 3.50% | 6.70% | 10.30% | 3.60% | 5.10% |
Source: BLS
Labor Trends
15-County Region
| County | 2023 | 2010 | 2000 |
|---|---|---|---|
| Bullitt (KY) | 81,729 | 74,319 | 61,241 |
| Clark (IN) | 120,185 | 110,232 | 96,473 |
| Floyd (IN) | 79,594 | 74,578 | 70,821 |
| Harrison (IN) | 39,516 | 39,364 | 34,327 |
| Henry (KY) | 15,691 | 15,416 | 15,060 |
| Jefferson (KY) | 780,449 | 741,096 | 693,614 |
| Oldham (KY) | 67,586 | 60,316 | 46,179 |
| Shelby (KY) | 47,523 | 42,074 | 33,338 |
| Spencer (KY) | 19,256 | 17,061 | 11,765 |
| Washington (IN) | 28,025 | 28,262 | 27,223 |
| Hardin (KY) | 110,134 | 105,543 | 94,174 |
| Meade (KY) | 29,735 | 28,602 | 26,349 |
| Nelson (KY) | 46,440 | 43,437 | 37,477 |
| Scott (IN) | 24,290 | 24,181 | 22,960 |
| Trimble (KY) | 8,502 | 8,809 | 8,125 |
| 15-County Greater Louisville Region | 1,498,655 | 1,413,290 | 1,279,126 |
Source: Lightcast