The Fouridor and more awaits you.
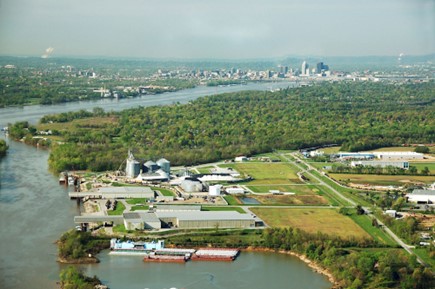
Clark County, Indiana, is located on Interstate 65, a short drive north of Louisville, Kentucky. As the second-oldest county in Indiana, it is home to Jeffersonville, Clarksville, Charlestown, and Sellersburg, and several other municipalities. As part of the Fouridor, it is also an economic powerhouse, with the River Ridge Commerce Center and the Ports of Indiana – Jeffersonville.
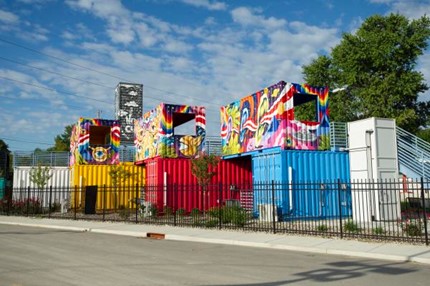
Clark County is located on the banks of the Ohio River and is home to a plethora of attractions, including the Big Four Bridge, the RiverStage, Huber’s Orchard & Winery, Joe Huber Family Farm & Restaurant, Clark County Regional Airport, and the NoCo Arts & Cultural District.

The Fouridor, or “the corridor with more,” is the term used to describe the four types of transportation in Clark County: river, rail, runways, and roads. Due to this unique set-up, businesses have access to many transportation methods to import and export products, making it a bustling area for economic activity and growth.
- The River Ridge Commerce Center is a 6,000-acre business and industrial park and is home to over 70 companies, including Amazon, American Fuji Seal, Canadian Solar, CEVA Logistics, D.A. Inc., Denso, GE Appliances, OmniTRAX, and Sazerac. River Ridge is a prime location for global businesses and is easily accessible due to its convenient location within the Fouridor.
- The Ports of Indiana– Jeffersonville handles over 2 million tons of cargo annually and is at mile marker 597 on the Ohio River, making it an ideal location for multiple industries. Using barges, ships, trucks, and railcars, it moves cargo throughout the country and global markets, as the Port is Foreign Trade Zone (FTZ)-certified.

Not only is Clark County a great place to live, but it is home to major economic growth and development, with more and more industries moving here, creating a booming region and a great place to live.
Clark County Municipalities:
- Townships – Bethlehem, Carr, Charlestown, Jeffersonville Monroe, Oregon, Owen, Silver Creek, Union, Utica, Washington, and Wood
- Cities and Towns – Borden, Charlestown, Clarksville, Jeffersonville, New Providence, Sellersburg, and Utica
Additional Resources:
Clark County by the Numbers
Clark County
Clark County
| Clark County | 2012 | 2022 | % Change |
|---|---|---|---|
| Population | 111,879 | 124,984 | 11.7% |
| Gross Regional Product | $4,162,010,163 | $6,941,350,416 | 66.8% |
| Median Household Income | $62,296 | ||
| Per Capita Income | $31,542 | ||
| Poverty Level | 10.0% | ||
| Unemployment Rate | 2.4% | ||
| Labor Force Participation Rate | 62.9% | ||
| Average Commute Time | 23.1 | ||
| Number of Remote Workers | 4,824 | ||
| Percent of Remote Workers | 8.1% | ||
| Education: Less than 9th Grade | 3,491 | 2,060 | -41.0% |
| Education: 9-12th Grade | 7,280 | 5,568 | -23.5% |
| Education: High School Diploma | 27,265 | 31,107 | 14.1% |
| Education: Some College | 17,706 | 19,467 | 9.9% |
| Education: Associate's Degree | 6,614 | 9,351 | 41.4% |
| Education: Bachelor's Degree | 9,403 | 13,860 | 47.4% |
| Education: Graduate Degree and Higher | 4,860 | 6,343 | 30.5% |
| Homeowner Vacancy Rate | 1.5% | ||
| Median House Value | $162,800 | ||
| Median Monthly Rent | $903 | ||
| Percent Occupied Housing Units | 89.6% |
Greater Louisville Region
Greater Louisville Region
| Greater Louisville Region | 2012 | 2022 | % Change |
|---|---|---|---|
| Population | 1,434,953 | 1,517,937 | 5.8% |
| Gross Regional Product | $69,126,603,887 | $106,360,978,850 | 53.9% |
| Median Household Income | $71,033 | ||
| Per Capita Income | $34,919 | ||
| Poverty Level | 7.6% | ||
| Unemployment Rate | 3.5% | ||
| Labor Force Participation Rate | 62.4% | ||
| Average Commute Time | 27.0 | ||
| Number of Remote Workers | 59,276 | ||
| Percent of Remote Workers | 6.9% | ||
| Education: Less than 9th Grade | 41,826 | 28,187 | -32.6% |
| Education: 9-12th Grade | 84,226 | 66,209 | -21.4% |
| Education: High School Diploma | 312,017 | 315,945 | 1.3% |
| Education: Some College | 219,747 | 230,831 | 5.0% |
| Education: Associate's Degree | 71,758 | 96,301 | 34.2% |
| Education: Bachelor's Degree | 146,043 | 192,022 | 31.5% |
| Education: Graduate Degree or Higher | 93,667 | 123,660 | 32.0% |
| Homeowner Vacancy Rate | 1.3% | ||
| Median House Value | $178,593 | ||
| Median Monthly Rent | $847 | ||
| Percent Occupied Housing Units | 90.1% |
United States
United States
| United States | 2012 | 2022 | % Change |
|---|---|---|---|
| Population | 313,877,662 | 334,161,482 | 6.5% |
| Gross Regional Product | $15,912,802,819,300 | $24,767,834,615,600 | 55.6% |
| Median Household Income | $69,021 | ||
| Per Capita Income | $37,638 | ||
| Poverty Level | 8.9% | ||
| Unemployment Rate | 3.6% | ||
| Labor Force Participation Rate | 62.7% | ||
| Average Commute Time | 26.8 | ||
| Number of Remote Workers | 15,061,684 | ||
| Percent of Remote Workers | 9.7% | ||
| Education: Less than 9th Grade | 12,837,123 | 10,919,561 | -14.9% |
| Education: 9-12th Grade | 17,391,417 | 14,341,868 | -17.5% |
| Education: High School Diploma | 58,751,740 | 60,598,861 | 3.1% |
| Education: Some College | 44,359,412 | 45,588,261 | 2.8% |
| Education: Associate's Degree | 16,032,807 | 20,324,521 | 26.8% |
| Education: Bachelor's Degree | 37,281,933 | 47,929,733 | 28.6% |
| Education: Graduate Degree or Higher | 22,125,353 | 30,620,664 | 38.4% |
| Homeowner Vacancy Rate | 1.2% | ||
| Median House Value | $244,900 | ||
| Median Monthly Rent | $1,163 | ||
| Percent Occupied Housing Units | 88.8% |
