Midwest hospitality at its finest.
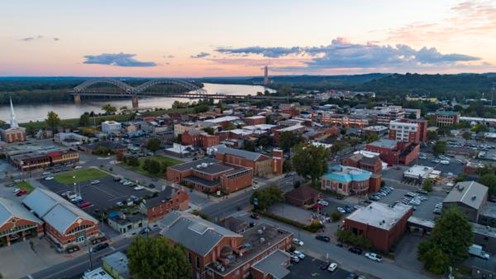
Floyd County, Indiana, is located a short drive away from the city of Louisville, Kentucky. As the second smallest landmass county in Indiana, it is home to several bustling rural and urban municipalities and is part of the historic Buffalo Trace pathway.
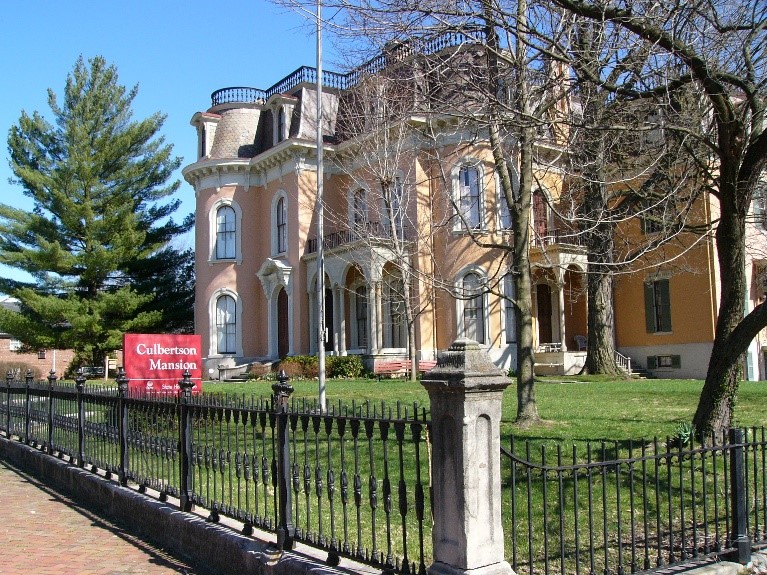
Floyd County is full of historic districts and landmarks. New Albany, the county seat, is home to the Culbertson Mansion, the Town Clock Church / Second Baptist Church, the Scribner House, and the first high school in Indiana (New Albany High School). Georgetown is home to the Georgetown Drive-In Theatre, one of the oldest drive-ins in the state.

NovaParke Innovation and Technology Campus, a collaborative location for research, innovation, creativity, and entrepreneurialism, is in Floyd County. Tenants include Redwire Corporation, a global space infrastructure leader, Indiana University Southeast, The Root, and other entrepreneurial-focused businesses.
One of the county’s highlights is its award-winning public school system, the New Albany-Floyd County School Corporation, including the Prosser Career Education Center, and higher-education institution, Indiana University Southeast. There are also several private and parochial schools.

Whether looking for a home with land to grow your family or a new location for your business venture, Floyd County is the place to be and stay.
Floyd County Municipalities:
- Townships – Franklin, Georgetown, Greenville, Lafayette, New Albany
- Cities and Towns – Georgetown, Greenville, New Albany
Additional Resources:
Floyd County by the Numbers
Floyd County
Floyd County
| Floyd County | 2012 | 2022 | % Change |
|---|---|---|---|
| Population | 75,284 | 81,284 | 8.0% |
| Gross Regional Product | $2,475,472,868 | $3,961,272,993 | 60.0% |
| Median Household Income | $69,858 | ||
| Per Capita Income | $34,961 | ||
| Poverty Level | 9.5% | ||
| Unemployment Rate | 2.1% | ||
| Labor Force Participation Rate | 66.3% | ||
| Average Commute Time | 23.0 | ||
| Number of Remote Workers | 3,384 | ||
| Percent of Remote Workers | 8.8% | ||
| Education: Less than 9th Grade | 1,830 | 1,063 | -41.9% |
| Education: 9-12th Grade | 4,374 | 3,689 | -15.7% |
| Education: High School Diploma | 17,686 | 17,400 | -1.6% |
| Education: Some College | 11,491 | 11,454 | -0.3% |
| Education: Associate's Degree | 4,157 | 5,400 | 29.9% |
| Education: Bachelor's Degree | 7,688 | 10,995 | 43.0% |
| Education: Graduate Degree and Higher | 3,705 | 6,373 | 72.0% |
| Homeowner Vacancy Rate | 1.8% | ||
| Median House Value | $187,900 | ||
| Median Monthly Rent | $868 | ||
| Percent Occupied Housing Units | 88.3% |
Greater Louisville Region
Greater Louisville Region
| Greater Louisville Region | 2012 | 2022 | % Change |
|---|---|---|---|
| Population | 1,434,953 | 1,517,937 | 5.8% |
| Gross Regional Product | $69,126,603,887 | $106,360,978,850 | 53.9% |
| Median Household Income | $71,033 | ||
| Per Capita Income | $34,919 | ||
| Poverty Level | 7.6% | ||
| Unemployment Rate | 3.5% | ||
| Labor Force Participation Rate | 62.4% | ||
| Average Commute Time | 27.0 | ||
| Number of Remote Workers | 59,276 | ||
| Percent of Remote Workers | 6.9% | ||
| Education: Less than 9th Grade | 41,826 | 28,187 | -32.6% |
| Education: 9-12th Grade | 84,226 | 66,209 | -21.4% |
| Education: High School Diploma | 312,017 | 315,945 | 1.3% |
| Education: Some College | 219,747 | 230,831 | 5.0% |
| Education: Associate's Degree | 71,758 | 96,301 | 34.2% |
| Education: Bachelor's Degree | 146,043 | 192,022 | 31.5% |
| Education: Graduate Degree or Higher | 93,667 | 123,660 | 32.0% |
| Homeowner Vacancy Rate | 1.3% | ||
| Median House Value | $178,593 | ||
| Median Monthly Rent | $847 | ||
| Percent Occupied Housing Units | 90.1% |
United States
United States
| United States | 2012 | 2022 | % Change |
|---|---|---|---|
| Population | 313,877,662 | 334,161,482 | 6.5% |
| Gross Regional Product | $15,912,802,819,300 | $24,767,834,615,600 | 55.6% |
| Median Household Income | $69,021 | ||
| Per Capita Income | $37,638 | ||
| Poverty Level | 8.9% | ||
| Unemployment Rate | 3.6% | ||
| Labor Force Participation Rate | 62.7% | ||
| Average Commute Time | 26.8 | ||
| Number of Remote Workers | 15,061,684 | ||
| Percent of Remote Workers | 9.7% | ||
| Education: Less than 9th Grade | 12,837,123 | 10,919,561 | -14.9% |
| Education: 9-12th Grade | 17,391,417 | 14,341,868 | -17.5% |
| Education: High School Diploma | 58,751,740 | 60,598,861 | 3.1% |
| Education: Some College | 44,359,412 | 45,588,261 | 2.8% |
| Education: Associate's Degree | 16,032,807 | 20,324,521 | 26.8% |
| Education: Bachelor's Degree | 37,281,933 | 47,929,733 | 28.6% |
| Education: Graduate Degree or Higher | 22,125,353 | 30,620,664 | 38.4% |
| Homeowner Vacancy Rate | 1.2% | ||
| Median House Value | $244,900 | ||
| Median Monthly Rent | $1,163 | ||
| Percent Occupied Housing Units | 88.8% |
