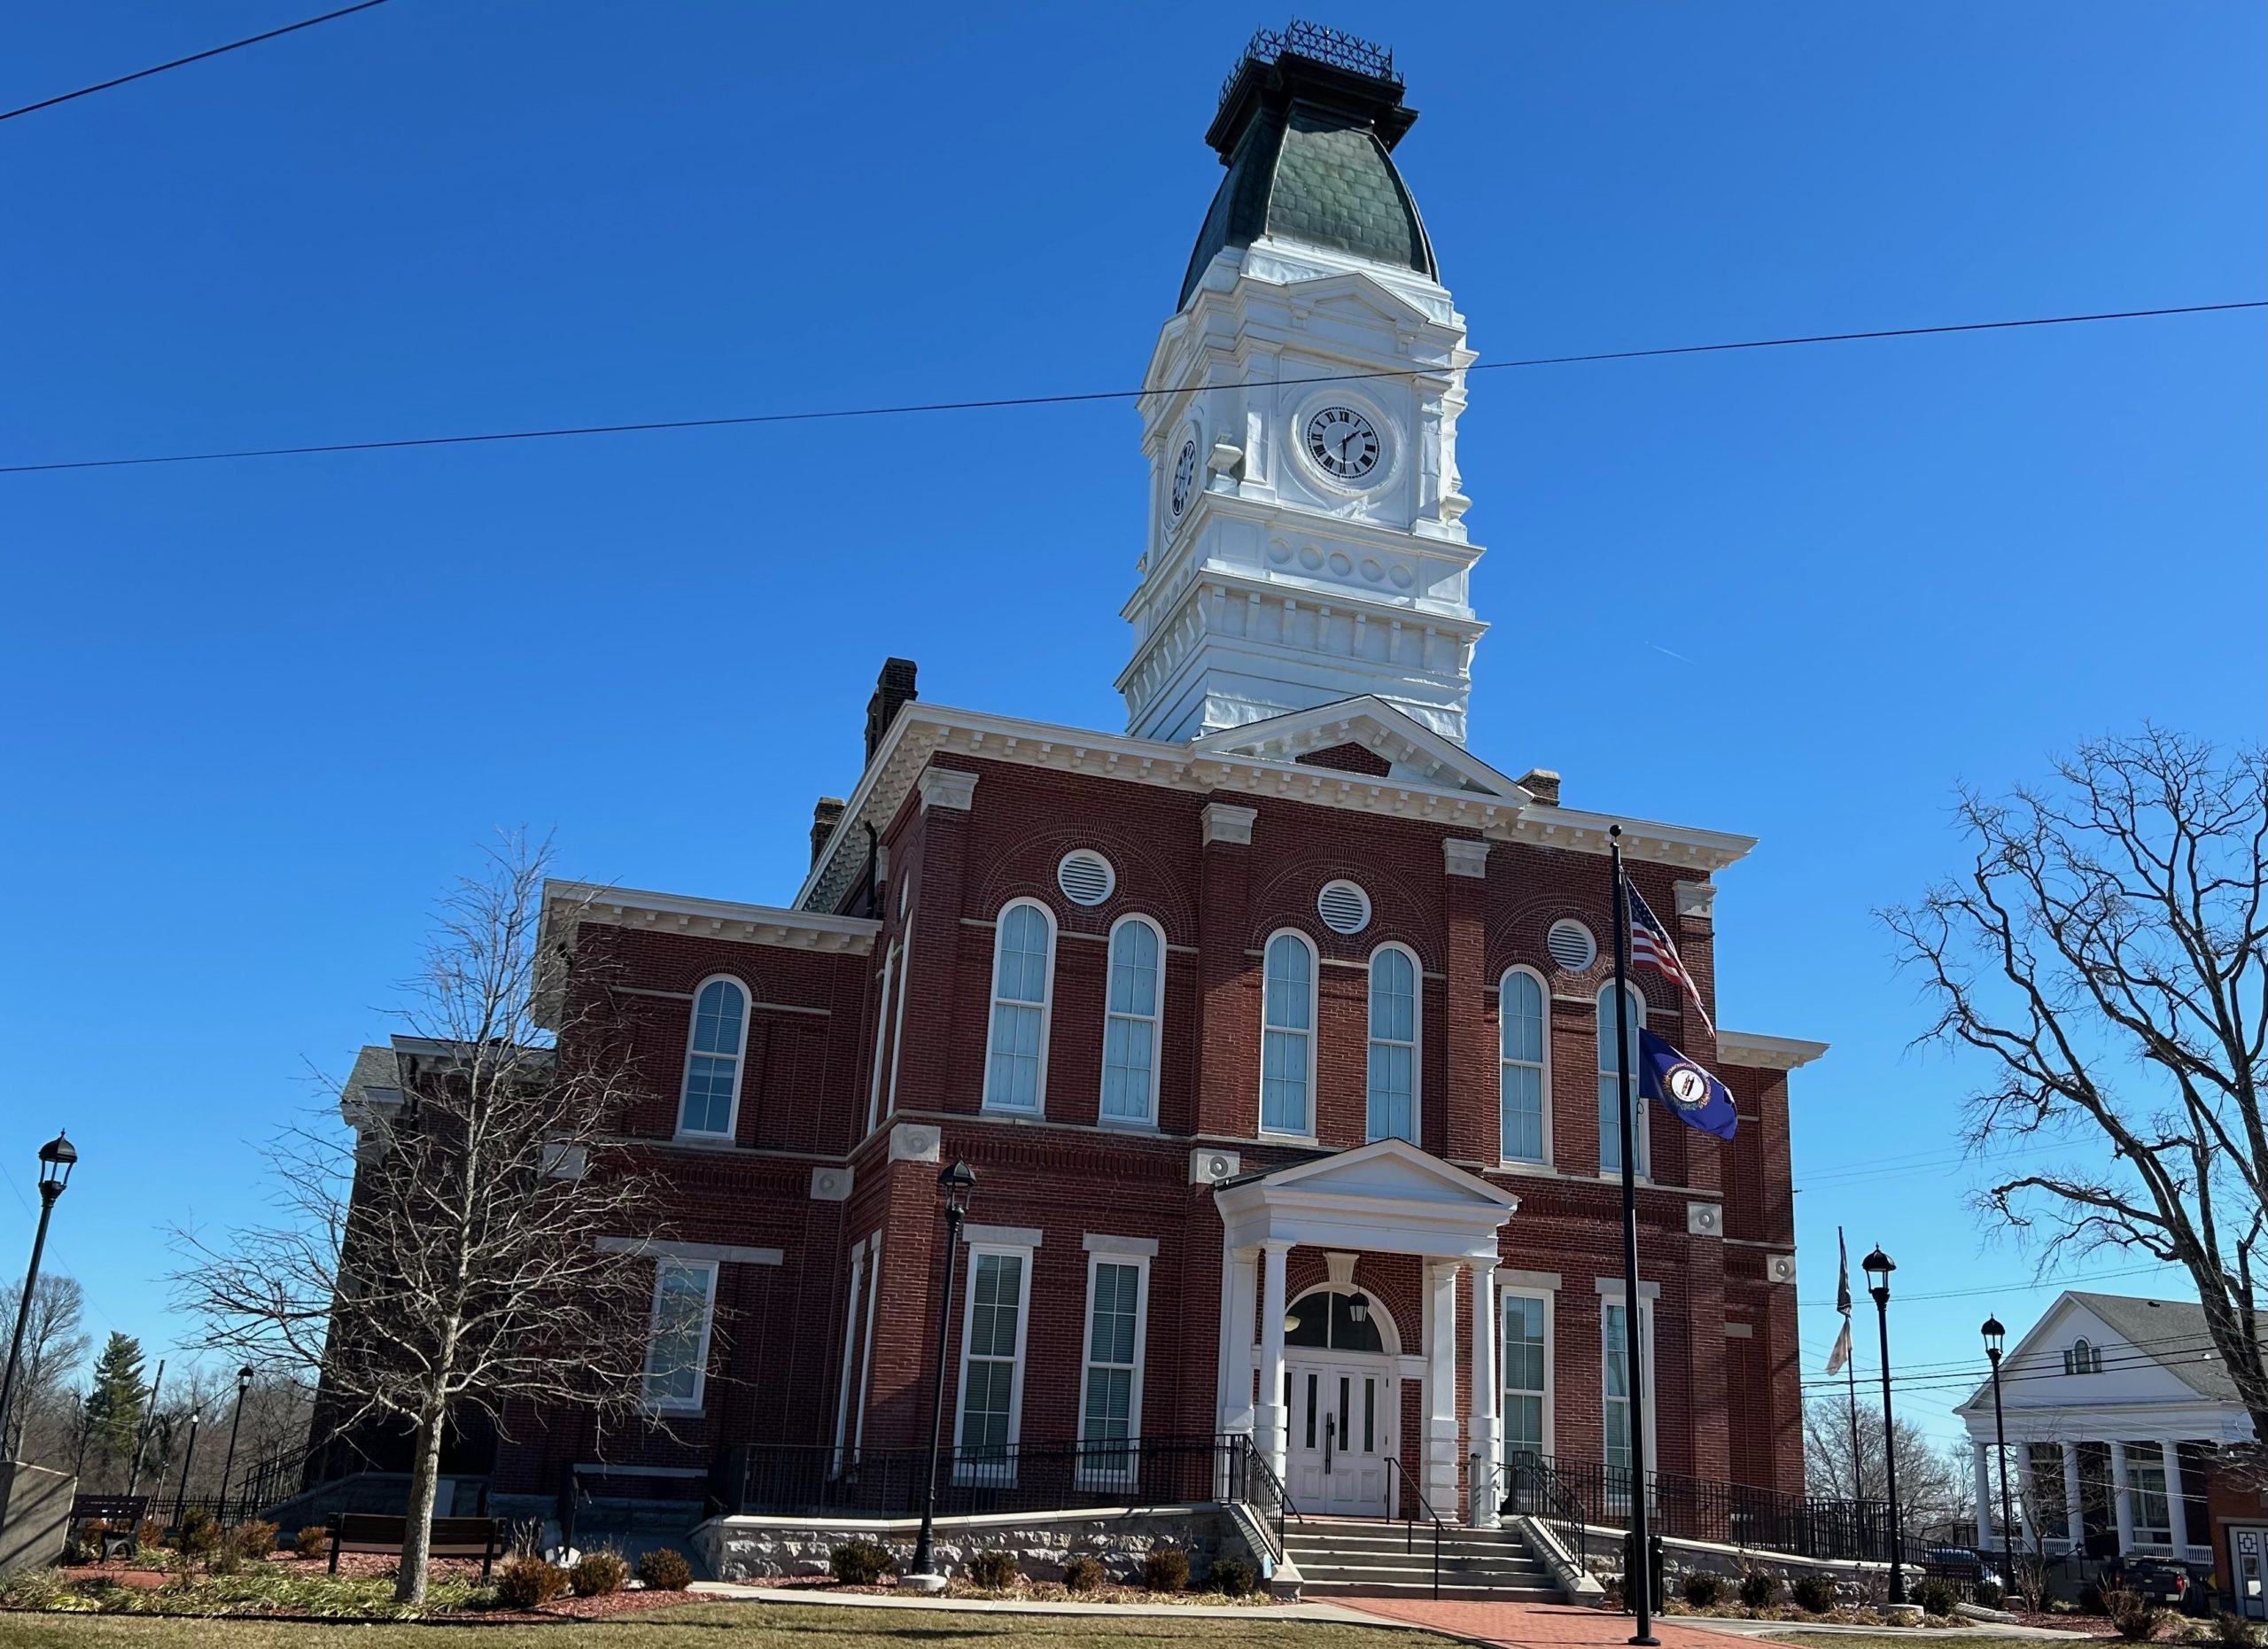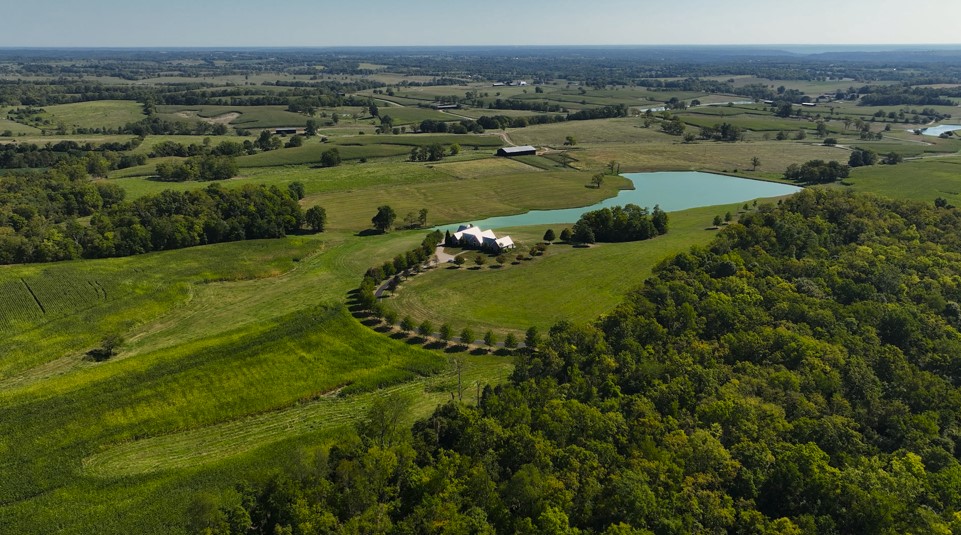
A picturesque oasis with fantastic amenities.
Henry County is located in what could be called a ‘golden triangle.’ Depending on the area of our relatively large county, you can be in Louisville, Lexington, or Cincinnati in an hour or less. We have the best of rural lifestyles with proximity to the amenities cities provide. Henry County rests northeast of Louisville on I-71 with two major exits and picturesque acres that expand into the scenic Kentucky River valley. The bourbon industry is making a strong presence in the county with a huge expansion of the Angel’s Envy brand and other distillers with sites and plans for more.

Businesses looking for an idyllic rural setting with plenty of acreage to expand should take a close look at all Henry County has to offer. Our once primarily agricultural economy is growing with industries and businesses capitalizing on the natural resources, workforce, and lifestyle available here. There are five small incorporated cities and acreage available throughout the county. With low tax rates, a hometown community feel, two noted school districts, and recreational opportunities, Henry County will warmly welcome you home.
Henry County by the Numbers
Henry County
Henry County
| Henry County | 2012 | 2022 | % Change |
|---|---|---|---|
| Population | 15,335 | 15,553 | 1.4% |
| Gross Regional Product | $294,302,907 | $376,005,900 | 27.8% |
| Median Household Income | $52,301 | ||
| Per Capita Income | $28,702 | ||
| Poverty Level | 17.4% | ||
| Unemployment Rate | 2.5% | ||
| Labor Force Participation Rate | 65.5% | ||
| Average Commute Time | 29.0 | ||
| Number of Remote Workers | 504 | ||
| Percent of Remote Workers | 7.6% | ||
| Education: Less than 9th Grade | 854 | 645 | -24.5% |
| Education: 9-12th Grade | 1,280 | 1,093 | -14.6% |
| Education: High School Diploma | 4,604 | 4,471 | -2.9% |
| Education: Some College | 1,812 | 2,381 | 31.4% |
| Education: Associate's Degree | 559 | 717 | 28.3% |
| Education: Bachelor's Degree | 913 | 962 | 5.4% |
| Education: Graduate Degree and Higher | 513 | 568 | 10.7% |
| Homeowner Vacancy Rate | 1.4% | ||
| Median House Value | $140,700 | ||
| Median Monthly Rent | $810 | ||
| Percent Occupied Housing Units | 90.1% |
Greater Louisville Region
Greater Louisville Region
| Greater Louisville Region | 2012 | 2022 | % Change |
|---|---|---|---|
| Population | 1,434,953 | 1,517,937 | 5.8% |
| Gross Regional Product | $69,126,603,887 | $106,360,978,850 | 53.9% |
| Median Household Income | $71,033 | ||
| Per Capita Income | $34,919 | ||
| Poverty Level | 7.6% | ||
| Unemployment Rate | 3.5% | ||
| Labor Force Participation Rate | 62.4% | ||
| Average Commute Time | 27.0 | ||
| Number of Remote Workers | 59,276 | ||
| Percent of Remote Workers | 6.9% | ||
| Education: Less than 9th Grade | 41,826 | 28,187 | -32.6% |
| Education: 9-12th Grade | 84,226 | 66,209 | -21.4% |
| Education: High School Diploma | 312,017 | 315,945 | 1.3% |
| Education: Some College | 219,747 | 230,831 | 5.0% |
| Education: Associate's Degree | 71,758 | 96,301 | 34.2% |
| Education: Bachelor's Degree | 146,043 | 192,022 | 31.5% |
| Education: Graduate Degree or Higher | 93,667 | 123,660 | 32.0% |
| Homeowner Vacancy Rate | 1.3% | ||
| Median House Value | $178,593 | ||
| Median Monthly Rent | $847 | ||
| Percent Occupied Housing Units | 90.1% |
United States
United States
| United States | 2012 | 2022 | % Change |
|---|---|---|---|
| Population | 313,877,662 | 334,161,482 | 6.5% |
| Gross Regional Product | $15,912,802,819,300 | $24,767,834,615,600 | 55.6% |
| Median Household Income | $69,021 | ||
| Per Capita Income | $37,638 | ||
| Poverty Level | 8.9% | ||
| Unemployment Rate | 3.6% | ||
| Labor Force Participation Rate | 62.7% | ||
| Average Commute Time | 26.8 | ||
| Number of Remote Workers | 15,061,684 | ||
| Percent of Remote Workers | 9.7% | ||
| Education: Less than 9th Grade | 12,837,123 | 10,919,561 | -14.9% |
| Education: 9-12th Grade | 17,391,417 | 14,341,868 | -17.5% |
| Education: High School Diploma | 58,751,740 | 60,598,861 | 3.1% |
| Education: Some College | 44,359,412 | 45,588,261 | 2.8% |
| Education: Associate's Degree | 16,032,807 | 20,324,521 | 26.8% |
| Education: Bachelor's Degree | 37,281,933 | 47,929,733 | 28.6% |
| Education: Graduate Degree or Higher | 22,125,353 | 30,620,664 | 38.4% |
| Homeowner Vacancy Rate | 1.2% | ||
| Median House Value | $244,900 | ||
| Median Monthly Rent | $1,163 | ||
| Percent Occupied Housing Units | 88.8% |
