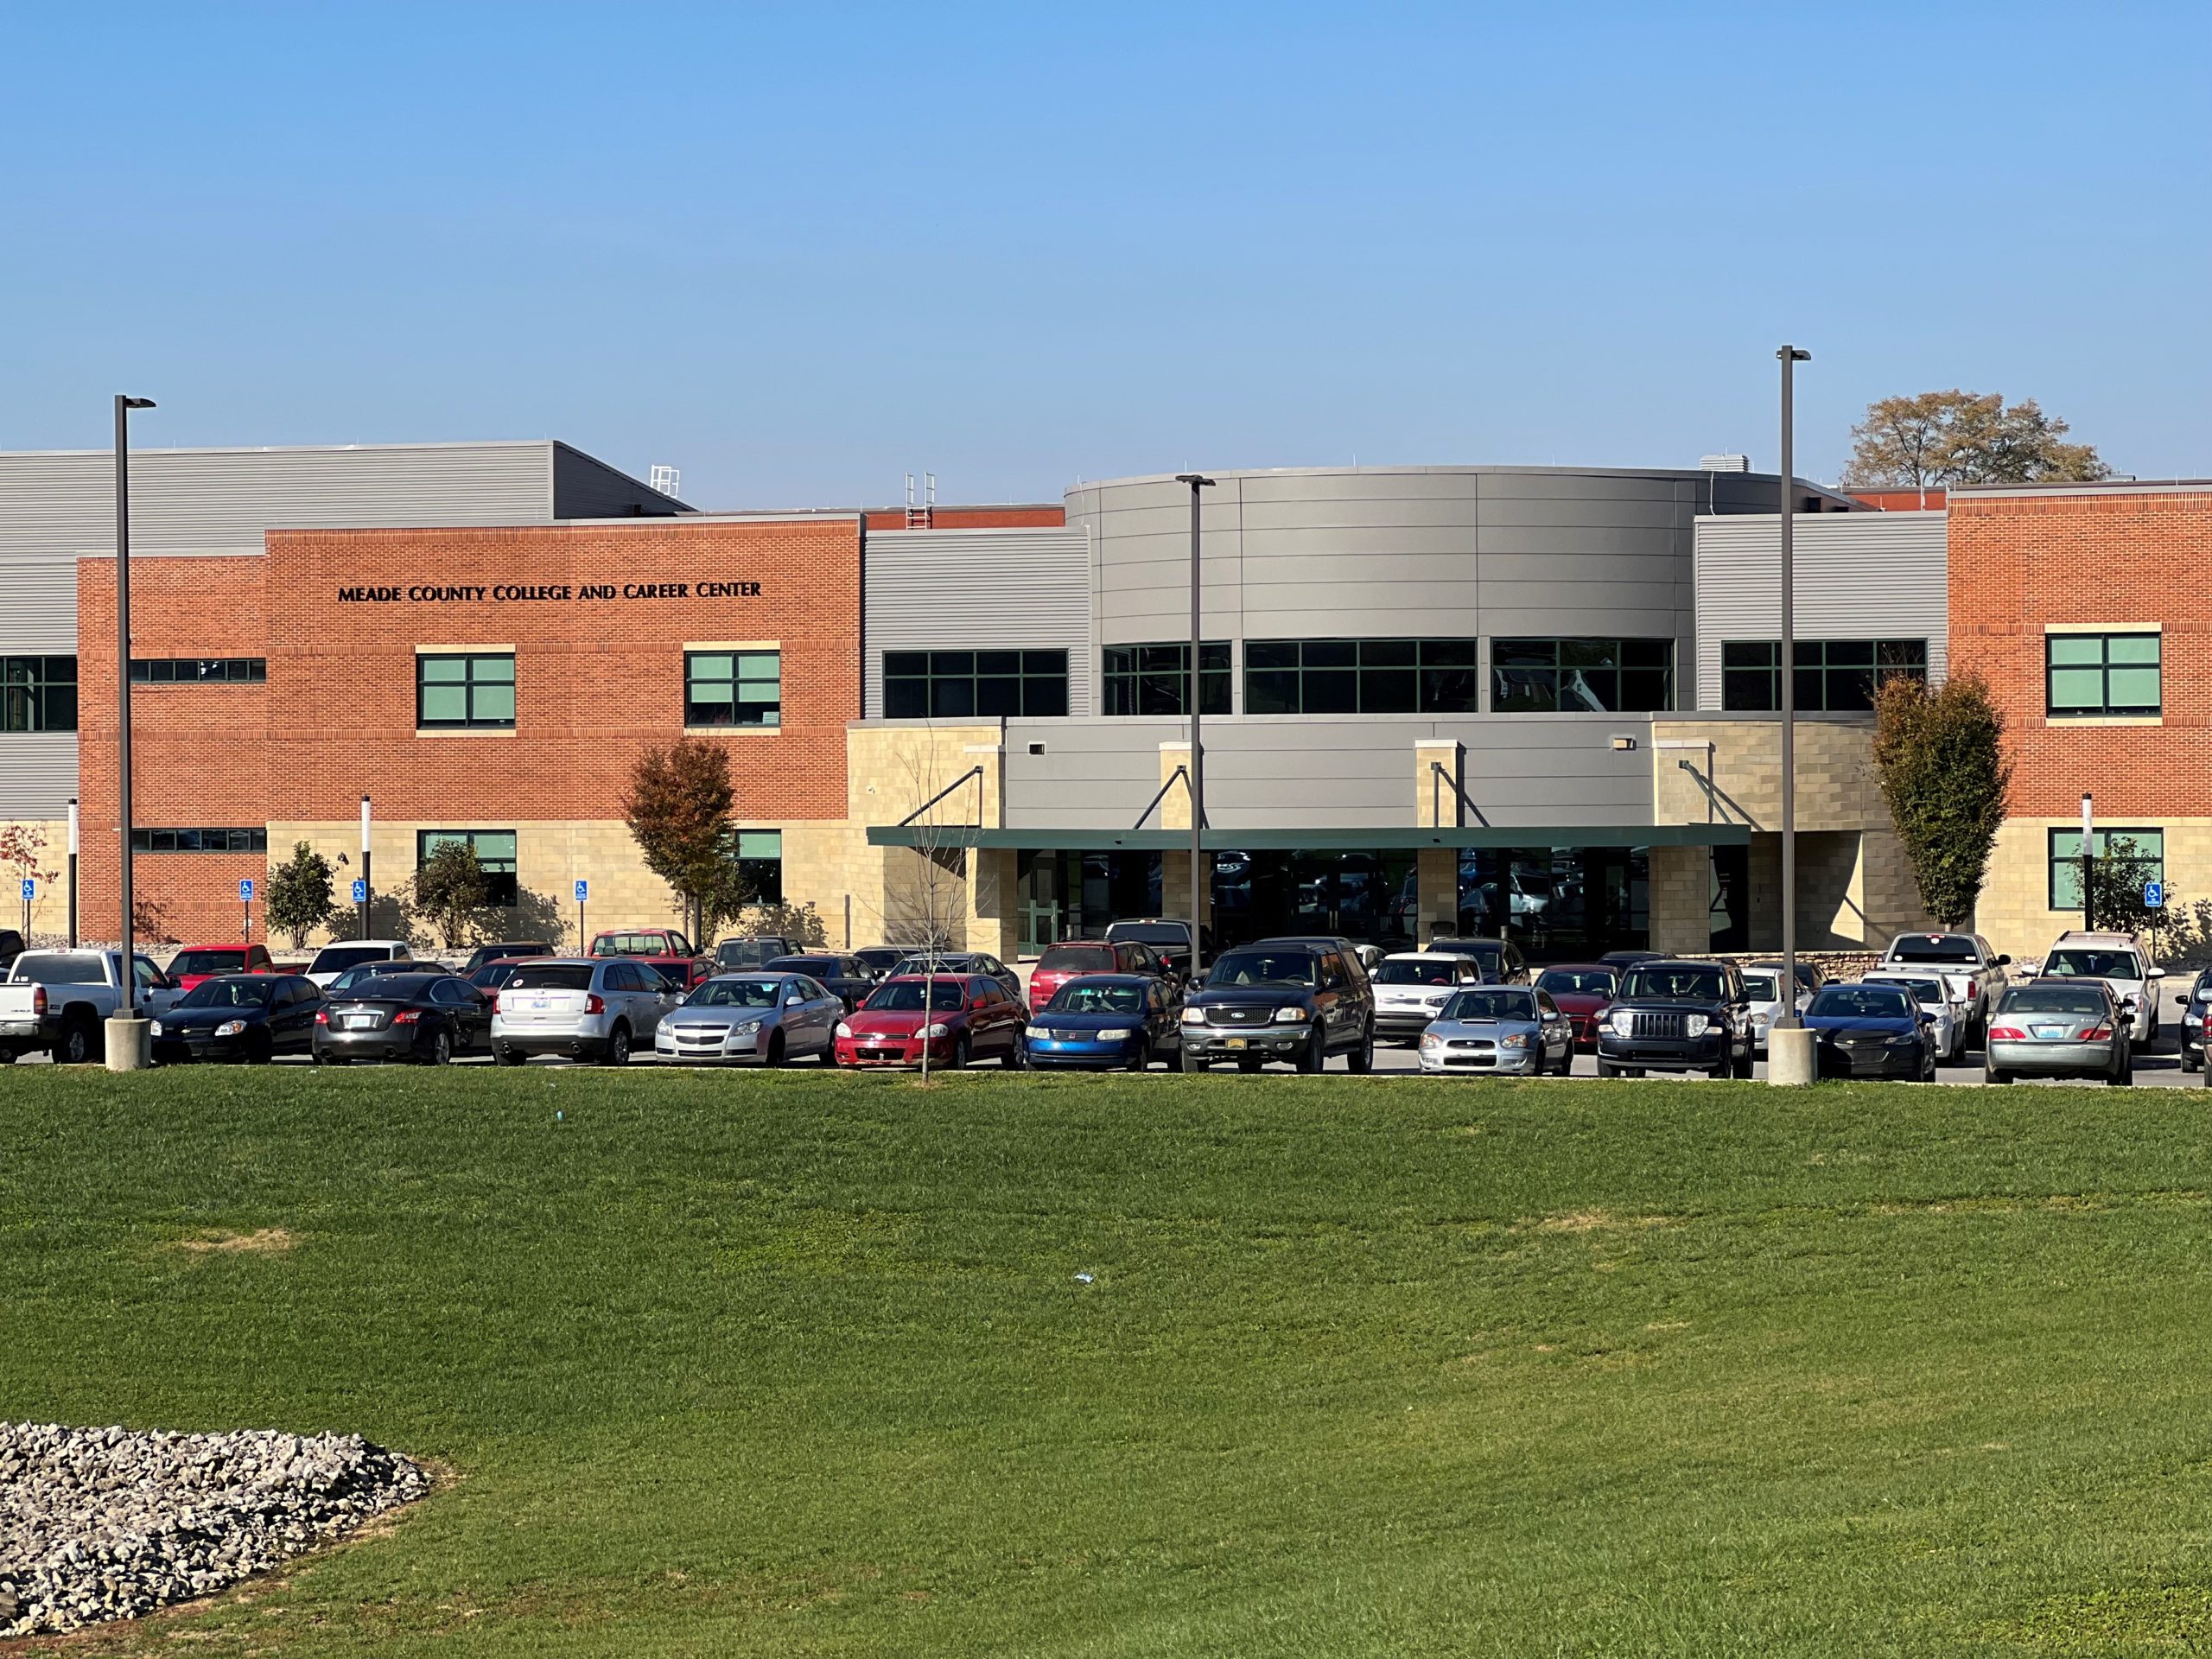
Scenic beauty paired with a thriving commerce hub.
Nestled near world-renowned Fort Knox and on the banks of the Ohio River, Meade County is a thriving hub for commerce. Its economic heartbeat comes from large businesses in advanced manufacturing like Monument Chemical and the newly constructed Nucor Brandenburg Steel Mill. These companies continue to invest in the county and propel its growth.
Nucor not only raised its average salaries to $75,000 a year with benefits but also invested heavily in education. Meade County is regarded across the state for its strong school system and career pipeline development. The extension office, the largest in the state, plays a pivotal role in culinary education, featuring 12 kitchens to meet the rising demand for restaurants and amenities. The Meade County Career & Technical Center, through a partnership with Nucor, trains 1,500 to 1,600 students in various careers. Local schools also got a boost with a $20 million investment, focusing on auto machines, Tool and Die, and HVAC programs. This investment opens more opportunities for students and helps the community thrive.

With a growing population of 30,000, Meade County is a county on the move. The county has experienced recent infrastructure and community investments, including a public library infused with a $2 million investment.
Meade County’s scenic beauty unfolds along its impressive 56 miles of riverfront, adorned with walking trails and lush greenery. Meade County is known for its robust transportation infrastructure, including rail and riverfront access that can help transport products efficiently.
Meade County by the Numbers
Meade County
Meade County
| Meade County | 2012 | 2022 | % Change |
|---|---|---|---|
| Population | 29,257 | 30,732 | 5.0% |
| Gross Regional Product | $454,129,107 | $832,153,071 | 83.2% |
| Median Household Income | $63,944 | ||
| Per Capita Income | $30,625 | ||
| Poverty Level | 13.1% | ||
| Unemployment Rate | 3.6% | ||
| Labor Force Participation Rate | 48.2% | ||
| Average Commute Time | 32.6 | ||
| Number of Remote Workers | 719 | ||
| Percent of Remote Workers | 5.4% | ||
| Education: Less than 9th Grade | 955 | 557 | -41.7% |
| Education: 9-12th Grade | 1,778 | 1,541 | -13.3% |
| Education: High School Diploma | 7,413 | 8,596 | 16.0% |
| Education: Some College | 4,910 | 4,738 | -3.5% |
| Education: Associate's Degree | 1,653 | 2,233 | 35.1% |
| Education: Bachelor's Degree | 1,262 | 2,217 | 75.7% |
| Education: Graduate Degree and Higher | 1,083 | 1,636 | 51.1% |
| Homeowner Vacancy Rate | 1.9% | ||
| Median House Value | $164,100 | ||
| Median Monthly Rent | $859 | ||
| Percent Occupied Housing Units | 86.3% |
Greater Louisville Region
Greater Louisville Region
| Greater Louisville Region | 2012 | 2022 | % Change |
|---|---|---|---|
| Population | 1,434,953 | 1,517,937 | 5.8% |
| Gross Regional Product | $69,126,603,887 | $106,360,978,850 | 53.9% |
| Median Household Income | $71,033 | ||
| Per Capita Income | $34,919 | ||
| Poverty Level | 7.6% | ||
| Unemployment Rate | 3.5% | ||
| Labor Force Participation Rate | 62.4% | ||
| Average Commute Time | 27.0 | ||
| Number of Remote Workers | 59,276 | ||
| Percent of Remote Workers | 6.9% | ||
| Education: Less than 9th Grade | 41,826 | 28,187 | -32.6% |
| Education: 9-12th Grade | 84,226 | 66,209 | -21.4% |
| Education: High School Diploma | 312,017 | 315,945 | 1.3% |
| Education: Some College | 219,747 | 230,831 | 5.0% |
| Education: Associate's Degree | 71,758 | 96,301 | 34.2% |
| Education: Bachelor's Degree | 146,043 | 192,022 | 31.5% |
| Education: Graduate Degree or Higher | 93,667 | 123,660 | 32.0% |
| Homeowner Vacancy Rate | 1.3% | ||
| Median House Value | $178,593 | ||
| Median Monthly Rent | $847 | ||
| Percent Occupied Housing Units | 90.1% |
United States
United States
| United States | 2012 | 2022 | % Change |
|---|---|---|---|
| Population | 313,877,662 | 334,161,482 | 6.5% |
| Gross Regional Product | $15,912,802,819,300 | $24,767,834,615,600 | 55.6% |
| Median Household Income | $69,021 | ||
| Per Capita Income | $37,638 | ||
| Poverty Level | 8.9% | ||
| Unemployment Rate | 3.6% | ||
| Labor Force Participation Rate | 62.7% | ||
| Average Commute Time | 26.8 | ||
| Number of Remote Workers | 15,061,684 | ||
| Percent of Remote Workers | 9.7% | ||
| Education: Less than 9th Grade | 12,837,123 | 10,919,561 | -14.9% |
| Education: 9-12th Grade | 17,391,417 | 14,341,868 | -17.5% |
| Education: High School Diploma | 58,751,740 | 60,598,861 | 3.1% |
| Education: Some College | 44,359,412 | 45,588,261 | 2.8% |
| Education: Associate's Degree | 16,032,807 | 20,324,521 | 26.8% |
| Education: Bachelor's Degree | 37,281,933 | 47,929,733 | 28.6% |
| Education: Graduate Degree or Higher | 22,125,353 | 30,620,664 | 38.4% |
| Homeowner Vacancy Rate | 1.2% | ||
| Median House Value | $244,900 | ||
| Median Monthly Rent | $1,163 | ||
| Percent Occupied Housing Units | 88.8% |
