Innovation paired with a small town atmosphere.
Scott County, Indiana, is located 30 minutes north of Louisville, Kentucky, straight up Interstate 65. Formed in 1820, it is now a charming scenic area with a large agricultural presence.
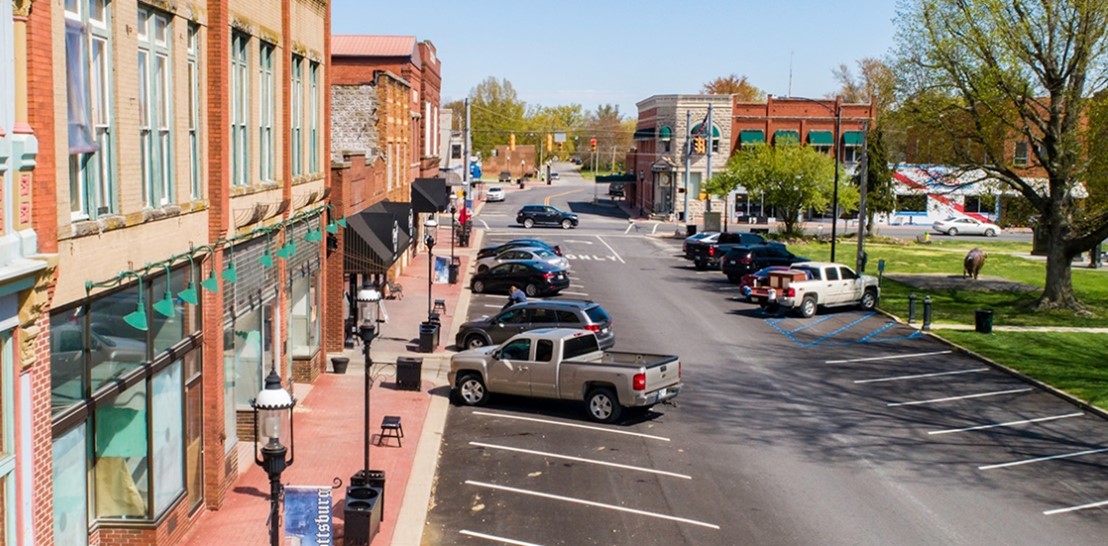
In Scottsburg, you’ll find a charming downtown city square filled with local businesses and the historic Scott Theatre. Scottsburg has several outdoor activities, including Hardy Lake State Recreation Area, Cornucopia Farm, and Knobstone Flower Farm. The city also boasts a manufacturing sector, with companies such as American Plastic Molding Corporation, Conco, Inc., Genpak Corporation, and Samtec, Inc. in the city.

The Mid-America Science Park and Conference Center, is located in Scottsburg. The center has 112,000 square feet of space, with an additional 19 acres reserved for expansion. The center focuses on training and workforce development for adults and students wishing to enhance their skills.
Austin, Indiana is home to Morgan Foods, the largest employer in Austin. Morgan Foods was established in 1899, and was a major employer during the Great Depression. Now, it is one of four manufacturing plants in the area. Austin has a small-town atmosphere and one stoplight. There are plans for renovations, reconstruction, and more economic development, making this not just an area to stop, but a place to live.
On April 8th, join Scott County for the solar eclipse! The county is included in the narrow band of the full eclipse, which will provide an exciting opportunity.

Whether you are stopping in for travel or pulling in for good, Scott County is a charming, scenic area with great people and exciting recreational opportunities.
Scott County Municipalities:
- Townships – Finley, Jennings, Johnson, Lexington, and Vienna
- Cities and Towns – Austin and Scottsburg
Additional Resources:
Scott County
Scott County
| Scott County | 2012 | 2022 | % Change |
|---|---|---|---|
| Population | 23,724 | 24,642 | 3.9% |
| Gross Regional Product | $528,670,226 | $860,961,677 | 62.9% |
| Median Household Income | $45,794 | ||
| Per Capita Income | $24,351 | ||
| Poverty Level | 16.6% | ||
| Unemployment Rate | 2.6% | ||
| Labor Force Participation Rate | 54,1% | ||
| Average Commute Time | 23.3 | ||
| Number of Remote Workers | 616 | ||
| Percent of Remote Workers | 5.9% | ||
| Education: Less than 9th Grade | 1,498 | 1,058 | -29.4% |
| Education: 9-12th Grade | 2,266 | 2,399 | 5.9% |
| Education: High School Diploma | 6,821 | 6,980 | 2.3% |
| Education: Some College | 2,982 | 3,107 | 4.2% |
| Education: Associate's Degree | 1,031 | 1,276 | 23.8% |
| Education: Bachelor's Degree | 1,088 | 1,634 | 50.2% |
| Education: Graduate Degree and Higher | 566 | 716 | 26.5% |
| Homeowner Vacancy Rate | 1.2% | ||
| Median Household Income | $117,100 | ||
| Median Monthly Rent | $733 | ||
| Percent Occupied Housing Units | 89.1% |
Greater Louisville Region
Greater Louisville Region
| Greater Louisville Region | 2012 | 2022 | % Change |
|---|---|---|---|
| Population | 1,434,953 | 1,517,937 | 5.8% |
| Gross Regional Product | $69,126,603,887 | $106,360,978,850 | 53.9% |
| Median Household Income | $71,033 | ||
| Per Capita Income | $34,919 | ||
| Poverty Level | 7.6% | ||
| Unemployment Rate | 3.5% | ||
| Labor Force Participation Rate | 62.4% | ||
| Average Commute Time | 27.0 | ||
| Number of Remote Workers | 59,276 | ||
| Percent of Remote Workers | 6.9% | ||
| Education: Less than 9th Grade | 41,826 | 28,187 | -32.6% |
| Education: 9-12th Grade | 84,226 | 66,209 | -21.4% |
| Education: High School Diploma | 312,017 | 315,945 | 1.3% |
| Education: Some College | 219,747 | 230,831 | 5.0% |
| Education: Associate's Degree | 71,758 | 96,301 | 34.2% |
| Education: Bachelor's Degree | 146,043 | 192,022 | 31.5% |
| Education: Graduate Degree or Higher | 93,667 | 123,660 | 32.0% |
| Homeowner Vacancy Rate | 1.3% | ||
| Median House Value | $178,593 | ||
| Median Monthly Rent | $847 | ||
| Percent Occupied Housing Units | 90.1% |
United States
United States
| United States | 2012 | 2022 | % Change |
|---|---|---|---|
| Population | 313,877,662 | 334,161,482 | 6.5% |
| Gross Regional Product | $15,912,802,819,300 | $24,767,834,615,600 | 55.6% |
| Median Household Income | $69,021 | ||
| Per Capita Income | $37,638 | ||
| Poverty Level | 8.9% | ||
| Unemployment Rate | 3.6% | ||
| Labor Force Participation Rate | 62.7% | ||
| Average Commute Time | 26.8 | ||
| Number of Remote Workers | 15,061,684 | ||
| Percent of Remote Workers | 9.7% | ||
| Education: Less than 9th Grade | 12,837,123 | 10,919,561 | -14.9% |
| Education: 9-12th Grade | 17,391,417 | 14,341,868 | -17.5% |
| Education: High School Diploma | 58,751,740 | 60,598,861 | 3.1% |
| Education: Some College | 44,359,412 | 45,588,261 | 2.8% |
| Education: Associate's Degree | 16,032,807 | 20,324,521 | 26.8% |
| Education: Bachelor's Degree | 37,281,933 | 47,929,733 | 28.6% |
| Education: Graduate Degree or Higher | 22,125,353 | 30,620,664 | 38.4% |
| Homeowner Vacancy Rate | 1.2% | ||
| Median House Value | $244,900 | ||
| Median Monthly Rent | $1,163 | ||
| Percent Occupied Housing Units | 88.8% |
